There are weather reports stating that the volume of fine dust in the air is ‘bad’ and recommending that people stay indoors to avoid exposure to the fine dust air pollution. Over the past 3 years, the fine dust index has steadily increased 10-20%.
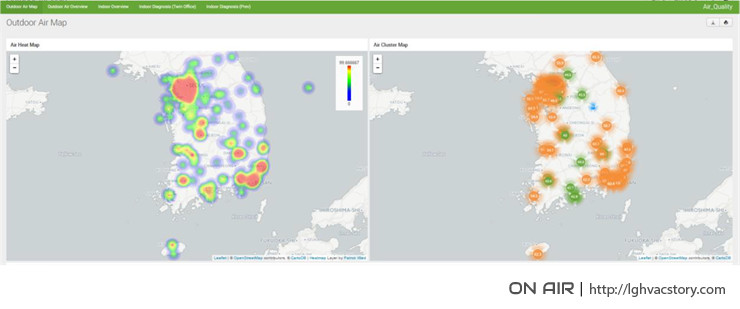
LG Intellytics has developed a dashboard that collects and analyzes air quality sensor data. With this technology, we are able to observe the outdoor air quality together with the air quality in places where we reside such as our homes and offices. Outdoor air quality is collected from the Korean Environment Corporation through API and Intellytics acquires this data to create visual representation via heat maps and cluster maps.
The quality of the air indoors is then collected via sensors and an analysis dashboard is created based on this data. These indoor air sensors are able to measure toxic substances in the air such as Volatile Organic Compounds (VOC), formaldehyde and carbon-dioxide. The 4-level scale system makes it easy to check the air quality and receive consultation to improve air quality depending on the quality level.
The dashboard collects indoor air quality data and performs a diverse range of analysis. Let’s take a look at some of the interesting analysis results we can obtain from the dashboard. Air quality measurement pilot testing was done in 15 households and it was found that the fine dust in the air found indoors that is known to cause respiratory illnesses was directly impacted by the amount of fine dust found in the air outside. If we look at the graph below, we can see that in 2 frequently ventilated homes, the fine dust volume patterns indoors and outdoors are quite similar. After all the doors and windows in the homes were closed for 1 week, the fine dust volumes in the homes lowered significantly regardless of the fine dust volumes outdoors. When leaving the windows open in the home, it is important to first check the outdoors fine dust levels.

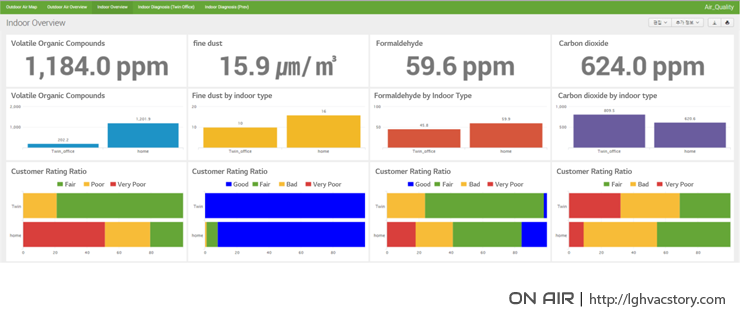
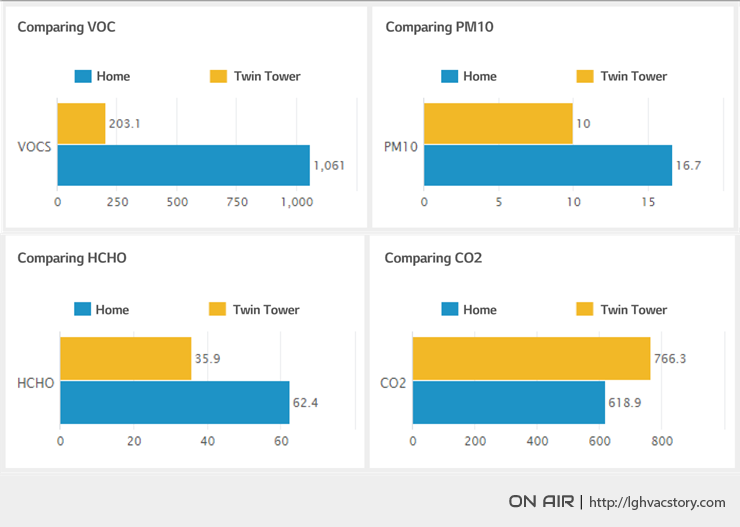
This is the air quality analysis results of a typical office and home where most office workers spend the majority of their time. The graph below shows a comparison of air quality in an office building in Seoul during the month of October. For the most part, the air in the office building was of better quality than the air quality in a typical home. However, the carbon-dioxide levels in the office were found to be higher.
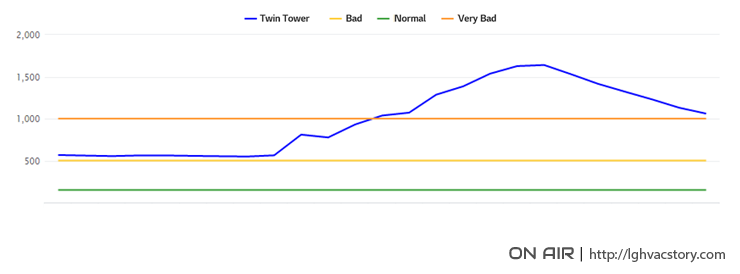
If we look closely, we can see that the carbon-dioxide levels in the evening are at least 3 times higher than the 400-600ppm recorded in the morning. The evening carbon-dioxide levels reach 1,500-1,600ppm. Carbon-dioxide is a natural by-product of people breathing, but prolonged exposure to high levels of carbon-dioxide make it hard to intake oxygen and can cause sleepiness and lethargy. If an ordinary office has levels this high, we can assume how much higher they would be in a closed meeting room. To improve concentration at work, ventilate your work space or try getting outside for a walk when possible.
Big data makes it possible to gain a more precise understanding of air quality analysis through a wide scope of measurements and research on the relationship between indoor and outdoor air will surely continue. Based on the results of this analysis, LG is able to implement services that will make our air purifier and humidifier products smarter solutions. We will continue to provide healthy and clean air!
LG Intellytics has developed a dashboard that collects and analyzes air quality sensor data. With this technology, we are able to observe the outdoor air quality together with the air quality in places where we reside such as our homes and offices. Outdoor air quality is collected from the Korean Environment Corporation through API and Intellytics acquires this data to create visual representation via heat maps and cluster maps.

Air Quality Mapping in South Korea
The quality of the air indoors is then collected via sensors and an analysis dashboard is created based on this data. These indoor air sensors are able to measure toxic substances in the air such as Volatile Organic Compounds (VOC), formaldehyde and carbon-dioxide. The 4-level scale system makes it easy to check the air quality and receive consultation to improve air quality depending on the quality level.

Indoor Fine Dust Pattern Analysis
The dashboard collects indoor air quality data and performs a diverse range of analysis. Let’s take a look at some of the interesting analysis results we can obtain from the dashboard. Air quality measurement pilot testing was done in 15 households and it was found that the fine dust in the air found indoors that is known to cause respiratory illnesses was directly impacted by the amount of fine dust found in the air outside. If we look at the graph below, we can see that in 2 frequently ventilated homes, the fine dust volume patterns indoors and outdoors are quite similar. After all the doors and windows in the homes were closed for 1 week, the fine dust volumes in the homes lowered significantly regardless of the fine dust volumes outdoors. When leaving the windows open in the home, it is important to first check the outdoors fine dust levels.

Analysis of indoor and outdoor fine dust
This is the air quality analysis results of a typical office and home where most office workers spend the majority of their time. The graph below shows a comparison of air quality in an office building in Seoul during the month of October. For the most part, the air in the office building was of better quality than the air quality in a typical home. However, the carbon-dioxide levels in the office were found to be higher.

Comparison between air quality in the office and the home (Oct, 2016)
If we look closely, we can see that the carbon-dioxide levels in the evening are at least 3 times higher than the 400-600ppm recorded in the morning. The evening carbon-dioxide levels reach 1,500-1,600ppm. Carbon-dioxide is a natural by-product of people breathing, but prolonged exposure to high levels of carbon-dioxide make it hard to intake oxygen and can cause sleepiness and lethargy. If an ordinary office has levels this high, we can assume how much higher they would be in a closed meeting room. To improve concentration at work, ventilate your work space or try getting outside for a walk when possible.

Twin Tower carbon dioxide level comparison
Big data makes it possible to gain a more precise understanding of air quality analysis through a wide scope of measurements and research on the relationship between indoor and outdoor air will surely continue. Based on the results of this analysis, LG is able to implement services that will make our air purifier and humidifier products smarter solutions. We will continue to provide healthy and clean air!


